
[ Editor’s note: This is part two of a two-part series on testing UAV survey accuracy. The first part covers project specifications, including hardware and software used. ]
This is part two of two regarding my jump into using UAVs for mapping. This post covers the errors found in the UAV collected data when compared to the laser scanner collected data—as well as other issues that presented themselves as I processed the data.
Processing
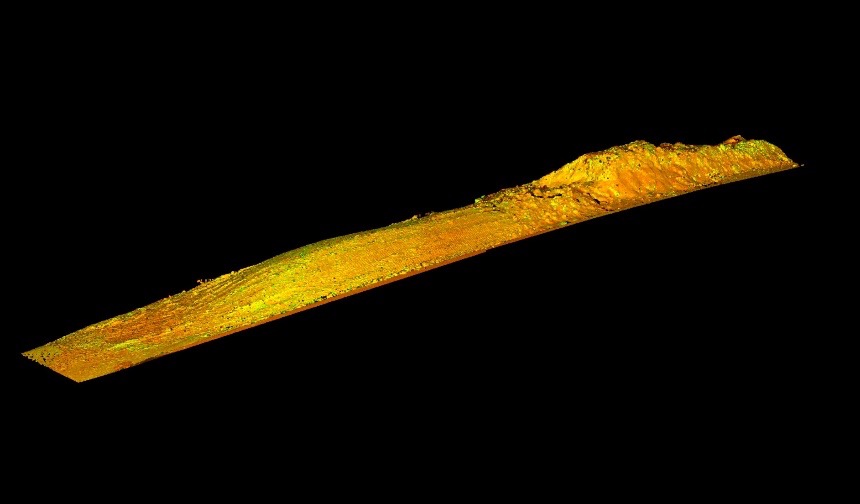
Let’s start with the product pile that was on site. As you may recall, I captured it with both a Leica C10 and with a DJI Phantom 3 Professional. At first, both data sets looked great. In order to eliminate as many variables as possible, I exported a point cloud from Pix4D and brought it into Leica Geosystems Cyclone for comparison with the C10 data. Since you can choose the density of point cloud when creating it in Pix4D, density issues would seem to be a moot point. However, I am of the opinion that point sampling from a mesh is like choosing the number of digits after zero when measuring: You should not sample at an interval that is greater than your per-pixel resolution as it gives the impression of higher accuracy than actually exists.
That being said, our Ground Sampling Distance was 1.2 in/pixel (3.05 cm/pixel) so we set our point cloud sampling spacing to match. The first thing that jumps out is how much denser the C10 data is. However, this has a much smaller effect on the overall accuracy then our next discovery.
Noise in the UAV Data
I needed to perform a bit of cleaning prior to creating the meshes that I used for the volumetric calculations, as with most point cloud data. To do this, I used a limit box and shaved away all the non-surface data. That’s when I noticed how noisy the UAV data was. I’m not sure what the exact cause of the noise is, but after calls to a few folks that have been in the UAV world much longer than myself, I received a few explanations.
The first suggestion was that it was a sign of lens aberration toward the edges of the images. When overlapped, this caused multiple “surfaces” that looked like range noise in the point cloud. I was also told that it could have been caused by our flight speed. We flew the site at 23 mph (37 kph), so with a shutter speed of 1/640th second, my drone has moved 0.6 in (1.6 cm) before the shutter closes to capture each image. While the images all appeared to be in focus, this can cause distortions which are referred to as “rolling shutter.”
Whatever caused the noise (it was most probably a combination of both issues), the resulting data left me with some decisions. For instance, should I select the middle, top, or bottom of the noise as the most accurate section? I hedged my bets and went with the middle. For the purposes of volumetric analysis, I don’t think it matters as long as I make the same decision every time. However, when comparing to absolute values it could cause some problems.
Vegetation and Lemonade
For the volumetric analysis, I wanted to replicate project conditions as much as possible. In most volume surveys that I have performed, the client wanted a numerical value and was completely unconcerned with the UCS. For both the UAV and the C10 data sets, we decided to separate the pile manually along the toe from the point cloud and then compare it to a surface created by selecting the natural ground as close to the toe as possible. This “natural ground” was meshed so that the surface under the pile would approximate the tilt of the surrounding surface as closely as possible.
One additional problem inspired us to make lemonade from lemons: When we arrived onsite, the promised product pile was partially covered in vegetation. After an hour of hand-pulling the waist-high weeds off of the pile, we decided to draw a line and divide the pile into two sections, one with and one without vegetation. The idea was to see how Pix4D handled the vegetation and clean it up in Cyclone prior to performing volumetric calculations. In the end the UAV data didn’t show much in the way of vegetation in that section, though it was quite visible in the C10 data.
However, as can be seen in the results table, the difference between the volumes were relatively similar to the clean section, so I think that Pix4D cleaned most of the weeds off and just kept the surface data. So, let’s take a look at the volume numbers.
Hard Numbers
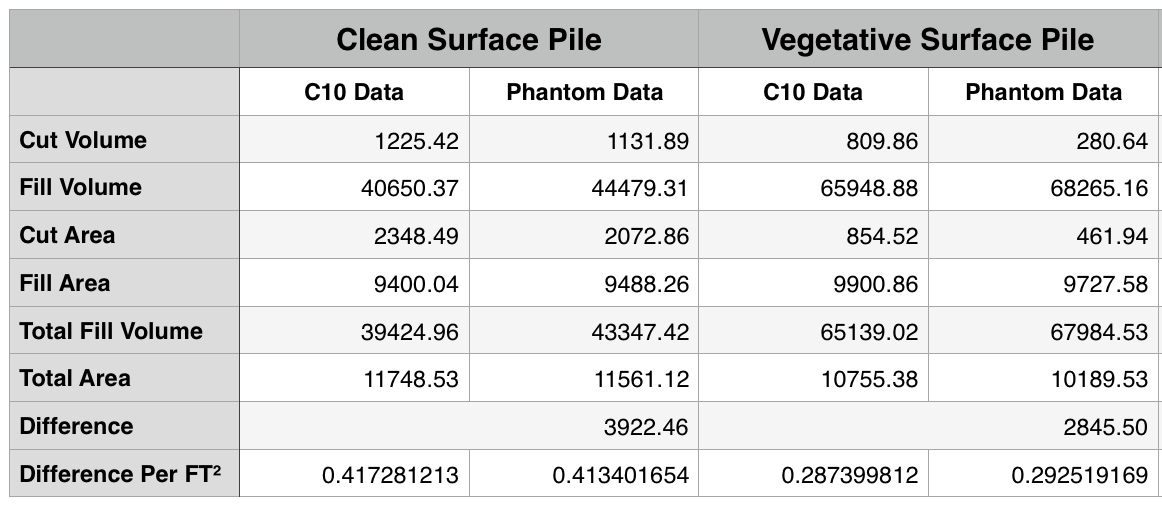
As you can see, the numbers aren’t too bad. In fact, I could make them better (as far as similar) with some slightly different choices.
Lessons Learned
The biggest “art vs. science” part of this is selecting the natural ground data. I have realized that I lean on intensity values a lot when I’m doing that with scan data. The only color info in the UAV data is RGB and it’s not perfectly aligned. This makes the selection of ground versus vegetation or the toe of the pile a bit more artistic than I’d like. With practice and a codified methodology, you could get repeatable results—but if you hand the same data to three different processors you’ll probably get three slightly different results. I’ve been doing this a while so I’m okay with differing results, but I can tell you that a lot of asset owners will not be happy to hear it.
In conclusion, I’ll do a few things differently next time around. I’ll fly slower, I’ll increase the percentage of image overlap, I’ll move up to a larger image sensor (probably around 20Mpx), I’ll use static GPS for control as opposed to RTK, and I’ll pay more attention to the lens I use. I’m confident that each of these factors added to the error that we saw in the final data, and I think I’ll have to address each one in order to get the type of results I’m looking for. Which brings us to an important question, what am I looking for? When do I want to use UAV’s?
I’d like to be able to generate topos, planning and visualization data from UAVs. Ideally, I’d like to be able to get data in that is accurate (absolute accuracy) to 1.5-3 in (3.5-7 cm) range. I’m not replacing a survey crew—I still need ground control and data under tree canopies, in ditches, and such. I’m looking at this as a solution for non-engineering data collection in large open areas, and not much else.
I hope this has been helpful to some of you. I’m still not hot enough on UAVs to go all in and I plan to continue to outsource data collection for the immediate future. However, I do believe that they are here to stay. As a client to service providers, I’m on the receiving end of a lot of marketing materials from UAV service providers. I certainly hope the cream of that crop will soon rise to the top.
As it is now, it can be difficult to tell a provider that is capable of mapping accuracy from one that is expanding his wedding photography business. If I could offer one bit of advice to those service providers, it’s this: Be honest and accurate. That means you can’t just quote the tech specs for your system as “attainable accuracy.” It’s incredibly aggravating to tell my bosses that I can only guarantee 4 in (10 cm) accuracy while he forwards me emails from service providers claiming 1 in (2.5 cm) accuracy all day long.
Lastly, I would like to thank a few folks that donated their time and knowledge to this project. Ben Linderman and Spencer Valdez of SnapRoll Media did quite a bit of flying for me. While they are not in the mapping industries, I can assure you that you’ve seen their work in a ton of movies and music videos. Nothing like getting Hollywood types to slum it for a bit! Simon Morris and Nick O’Nelio at Altus Intelligence were very helpful in helping me assess areas for improvement from a hardware and methodology perspective. If there is one thing that they convinced me of it was that “It’s all about the lens.” And finally, I want to thank Shane Lloyd at Unmanned Aerial Specialists for taking my (many) calls and answering more questions than I ever expected to have.