

Of all of the posts that I had published in 2017, the most read by far was the two-part field test report comparing UAV data to terrestrial LiDAR. Perhaps unsurprisingly, it also garnered the most comments. Thankfully, Sean Higgins handles the comment section so that I was spared from having to read most of those calling me an outright idiot (although he did summarize those for me). There were more than a few sales pitches in that lot that claimed that I didn’t know enough about what I was doing with a UAV to be anything other than dangerous.
To be clear, I didn’t disagree. The point of the exercise was to replicate what was/is happening all over the world as those that know about UAVs but not mapping try to map while those that know about mapping but not UAVs try to fly. In the aggregate I think that two positives resulted from those articles. 1) We were all reminded that there are times to rely upon those that are the professionals in their respected fields, and 2) I was able to start a dialogue with many more in the UAS space to work towards building best practices for the use of UAS for land surveying.
Hardware Decisions
In the intervening six months since my last post on the subject, I began meeting with multiple manufacturers’ reps and service providers – all of whom were certain that the majority of volumetric and topographic surveys could be captured via a UAS. While some were able to do so by upgrading the hardware components I found this to be a bit less enticing. Simply put, the market rate for UAS services is so low I don’t see how you’re supposed to make any profit flying a rig that costs tens of thousands of dollars.
Let me qualify that by stating that I am only familiar with the US market and that I am looking at this from the point of view of a service provider as opposed to an asset owner. I am quite confident that those metrics will change as US law via the FAA evolves and as the market matures. So, we stuck with the ubiquitous DJI Phantom 4 despite US Gov’t claims or DJI’s claims regarding the security of the data they collect.

Data Processing
Essentially, I went with the same test procedures as before: mapping a pile of rock with spot elevation checks and a comparison of volumetric calculations between the data derived from the UAS imagery and that collected with a Leica Geosystems ScanStation C10. Spoiler alert – the UAS did much better this time!
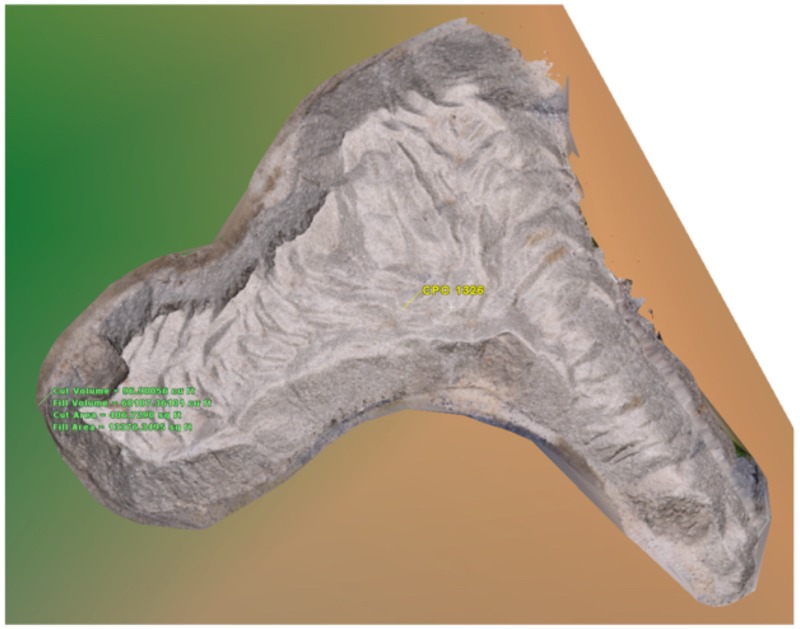
As before, data processing of UAS data was accomplished via Pix4D from which we exported a point cloud as our “final” result. This point cloud was imported into Leica Geosystems’ Cyclone Ver. 9.1 for comparison checking and for volumetric analysis. I used the “TIN Volume” tool to measure the volume of a TIN that was created from the data collected on the surface of the pile(s) versus a ground surface TIN. In an effort to remove one of the mitigating factors in my earlier tests we chose to determine the volumes of the product piles against identical surfaces created from established benchmarks as opposed to the “natural ground level” at the toe of the product pile.
Flight Parameters
I stated in my earlier posts that if repeated, “I’ll fly slower, I’ll increase the percentage of overlap, and I’ll move to a larger sensor.” All of which we did this time around. Going from the Phantom 3 to 4 upgraded the imaging device from 12MP to 20MP, we increased overlap to 85% (side and front), and we slowed way down. This time we flew at a groundspeed around 5 mph (2.3 m/s) versus 23mph (10.3 m/s). We also flew at a lower altitude 150 ft. (45.7 m) versus 240 ft. (73m). I did not, however, change the control collection methodology from RTK to static, as the margin of error was acceptable given the pixel resolution we were achieving.
In conversations with manufacturers and other UAS service providers/resellers one of the most often mentioned ways to improve the quality was through the use of higher-end lenses on the camera. In fact, some even went so far as to re-polish commercially available lenses to a higher grade in an effort to reduce lens aberration effects. We did not address any of those issues due to the aforementioned cost issues, as well as the fact that we were attempting to get the best results possible with an off-the-shelf UAS.
Lastly, we adjusted the flight lines. In addition to the adjustments made to increase the percentage of overlap, we also flew the site twice using two different flight lines that were at a 90° offset from one another. Essentially, the first flight was in a North-South pattern while the second was in an East-West pattern. All of the images were combined into a single dataset for processing in Pix4D.
 Results
As I mentioned before, the improvement in data quality was remarkable. The ranges noise on smooth surfaces was gone and the double flight line gridding allowed for complete coverage of all surfaces including some pile walls that were concave. In fact, the completeness of the coverage led to a questioning about the very basis of the test – the idea that the terrestrial LiDAR was the most accurate.
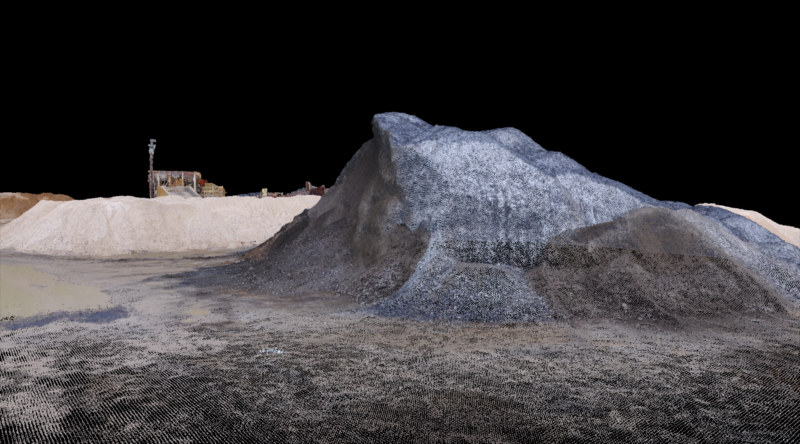
Once onsite, I picked two product piles for testing. I chose these two in particular because they were located next to one another and because they had radically different RGB values as one was black and the other off-white. Upon trying to scan the white pile it became obvious that I would not be able to get complete coverage on the top of the pile without climbing it and setting up on top of it—a problem that the UAV doesn’t have. I did so and processed the pile both with this “on top” data and without it, using only the scans I collected from ground level.
Leaving out the “on top” data resulted in a 2.17% increase in difference between the calculated volumes of the pile when compared to the data from the UAS. Seeing this lack of coverage result in greater variance I started to wonder if the variance between my UAV data and C10 data represented an error greater than or less than the actual volume of the product pile. While this is certainly a worthy question for consideration, my goal was to see when I could substitute UAS data for LiDAR. As a result, my clients want to know how they compare to one another as opposed to an idealized method so I have stated my results with this in mind.
When I compared the data I noticed that the color of the pile did not seem to have an effect on the values. At least if it did, it was much smaller an effect than the geometry of the pile. Once again, I suspect that the large undulations in the surface of the white pile resulted in a lower accuracy volume calculation from the laser scanner due to the lack of complete coverage which resulted in greater interpolation when creating the surface TIN.
My goal throughout this has been to develop a methodology that allowed me to get within 5% of the same results that I was achieving with a laser scanner. As you can see, I’ve certainly been able to achieve that:
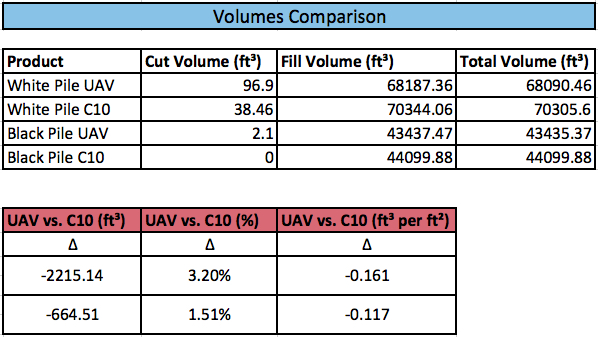
Additionally, spot checks of photo-identifiable positions with an RTK unit showed variances in elevation between 0.02 and 0.09 USFT (6mm and 27mm); all well within the margin of error for this type of work. All things being equal, I’d call this a success. Of course, all things are not equal and there are many times when this, like all measuring systems, can go awry. However, I can say that I have now confidently added UAS based services to my client offerings, and best of all, to my arsenal of applicable tools to use–even when the client did not specifically request it.
So, I’ve moved from only using it (with qualifications) when directly requested to do so, to considering it as the most efficient tool for some applications in less than a year. Ahhhh, technology…