
An integrated CIM model in Geo-Graphia
By Koji Kawamura, SPAR Japan
Recently I visited the Geoscience Research Laboratory (GRL) in Yamato, Japan, which is developing unique software called Geo-Graphia that renders fully integrated 3D models. As director Masaru Sato explained, Geo-Graphia visualizes not only artificial structures such as tunnels, buildings basements, and ditches, but also natural soil characteristics like strata, earthfaults, and underground water to use for various static and/or dynamic simulations.
Why is this necessary?
The increasing number of aged infrastructural assets in Japan is a problem. In order to extend their service life, we are working to improve the efficiency of infrastructure management. Based on the concept of Construction Information Modeling (CIM), we are integrating information across all stages of civil engineering projects, including planning, investigation, design, construction and maintenance.
What does Geo-Graphia do?
Geo-Graphia was designed to add an extra dimension to CIM models. Currently, these models often lack “underground” information obtained from excavation, such as geologic formations and groundwater distribution.
Geo-Graphia was also designed to update this underground information dynamically, since the volume of information increases and changes with time and in each stage of construction. It also augments that on-site data with measurement data acquired during construction and, most importantly, numerical analysis that predicts the effects of underground excavation.
The software augments the basic CIM by providing dynamic underground information, complete with predictive analysis. They call it a fully integrated underground model.
Geo-Graphia Functions
Using Geo-Graphia, users can:
- visualize and process common types of information such as CAD data, borehole logs, and image data, as well as topographic data like digital maps and point clouds.
- compile geological information (like borehole data and geological cross sections) into a database, which can in turn be used to render a 3D geological model.
- generate mesh data for numerical analysis and visualize the analysis results.
- visualize real time and long term monitoring data in a 3D model, which assists in disaster prevention.
- convert the Geo-Graphia models into more common CIM formats.
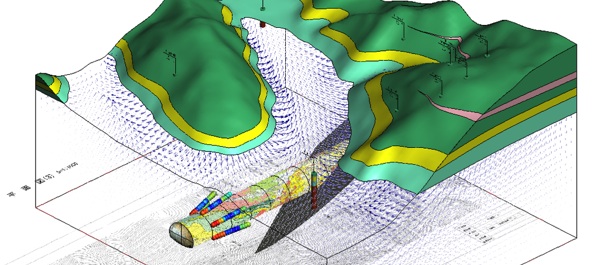
See below for a screenshot of an integrated model, and break-out graphics for each of the individual models.
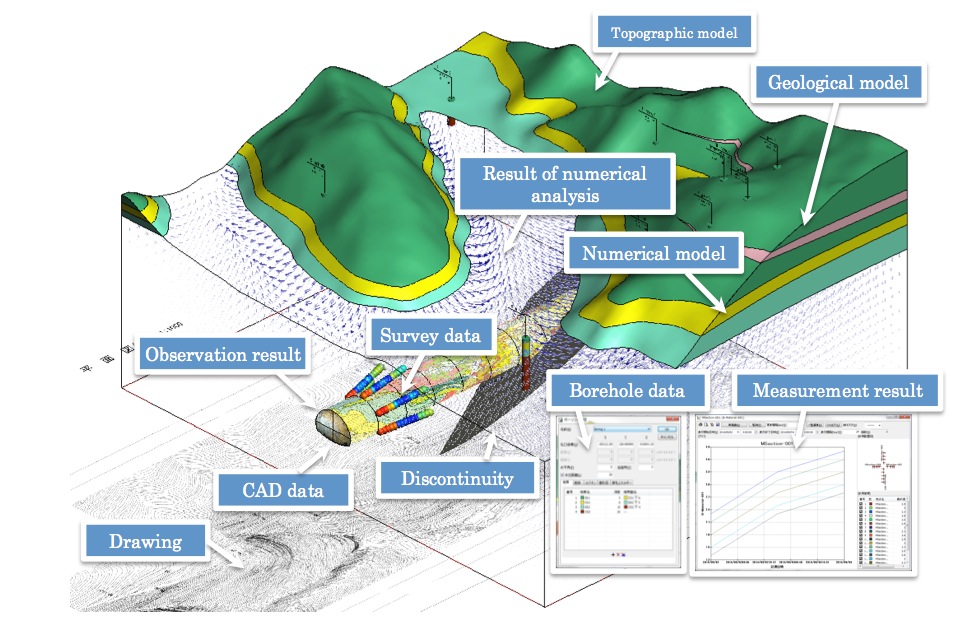
Integrated CIM Model from Geo-Graphia
Datasets included in the integrated model
Generating Analysis from a Model
As shown above, Geo-Graphia uses the data from 3D geological models to perform numerical analysis, which it then converts into a 3D visualization.
The program generates the mesh data for this visualization automatically, and assigns physical properties of each element according to the 3D geological model. It allows users to set initial conditions, boundary conditions and construction steps easily and visually.
Users can also visualize the results of numerical analysis in a variety of representations. For example, users can superimpose the analysis data on other underground information.
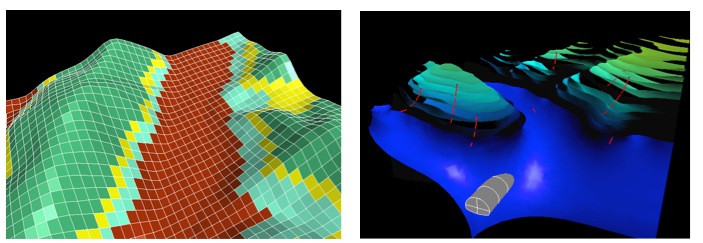
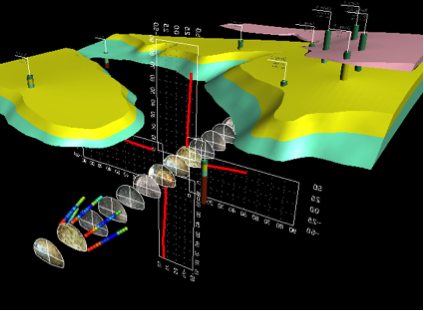
3D Mesh for numerical analysis (left) and visualization of analysis results (right)
A Use Case: More Sophisticated Observational Tunneling
These integrated visualizations, generated from the numerical analysis, offer assistance to construction managers in the process of tunneling. The visualizations help to estimate geology and risks ahead of the tunnel face by referring to the various types of data integrated in the model.
For instance, users can see deformation measurements and survey results in 3D. They can also overlay the numerical analysis directly on top of the model if necessary.
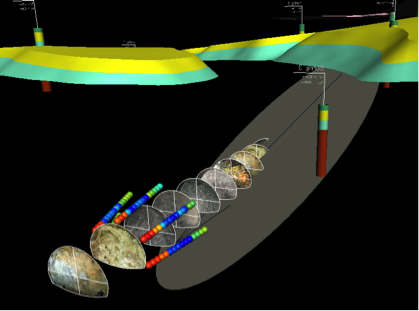
Integrated visualization of geological data obtained during excavation
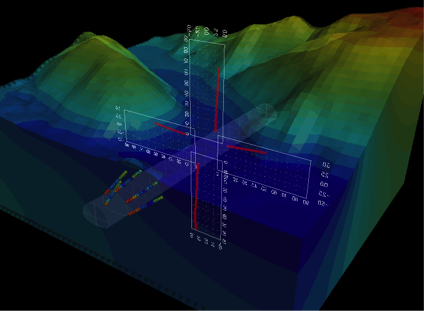
Integrated visualizations of numerical, measurement, and geological data
Assistance from Geoscience Research Laboratory
GRL offers the use of Geo-Graphia to their clients in three different ways. The client can:
- purchase the software and uses it independently
- provide GRL with their requirements and data. GRL executes the numerical analysis and returns visualization results to the client.
- work directly with GRL for assistance in using the Geo-Graphia software.
In this last case, analysts from a client firm and analysts from the GRL work together to execute simulations and present the results of those simulations in the most effective way possible. GRL analysts, as trained geoscientists, work with clients to understand their requirements and manipulate the parameters of the Geo-Graphia software to help their clients achieve the best results possible.
For clients who want to work with the GRL using the second or third option above, this graphic explains what the client supplies to GRL, and what GRL will return to the client.
Many civil engineering companies, power companies and governmental research groups in Japan are using this software. For more information, contact:
Masaru Sato: [email protected]


