

Esri BeLux and XenomatiX announced a cooperation that combines ArcGIS, the world’s most powerful mapping spatial analytics software from Esri, and the digital data from XenomatiX’ road lidar. This way, users of both Esri and XenomatiX are offered an overview on the road condition at a glance, so they can find the spot that needs attention and easily understand the cause and the remedy to be planned, all with high accuracy in data and geospatial context.
Analyzing lidar data with 2D picture data
Through ArcGIS, XenomatiX promotes the data sharing capacity and the apps to analyze 2D picture data collected simultaneously with the lidar data. The lidar point clouds are combined to create the digital road. Both digital road and calculated measures can be uploaded allowing the user to drill-down and find causes and repair suggestions in the detailed level. The data can be used both in ArcGIS desktop (local data storage) and ArcGIS Online (cloud storage).
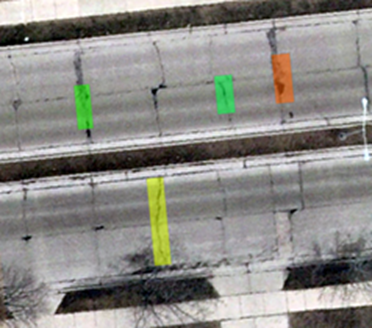
The data is color coded and uploaded in .laz format in ArcGIS. This means that from the proprietary XenomatiX format, the user can automatically translate to the .laz industry standard and upload in this format. Machine learning (ML) on top of imagery and/or lidar allows for instance for road crack detection in which you can then choose to display damage coding and ortho imagery to have visual control of the damage, as displayed here (see image above).
Finding correlation between data layers
In March 2022, XenomatiX announced a new version of XenoTrack, that comes with enhanced functionality and a fully integrated total solution with HD camera and RTK GNSS. Road characteristics such as the international roughness index and rutting index are quantified while driving and provide road management and construction companies with a fast assessment of pavement quality.
XenomatiX and Esri BeLux signed this recent partnership to proactively exchange and support applications and use cases serving both customer bases. Multiple ArcGIS users already have tree data, green data and sewage data in their GIS. By including road data such as those collected by the latest version of XenoTrack, a correlation between the layers can be found: not maintained green causes over time sewage blockage and road degradation like crocodile cracks. The network of Esri partners developed many customized applications for ArcGIS users, who can now combine these applications with the road condition data.
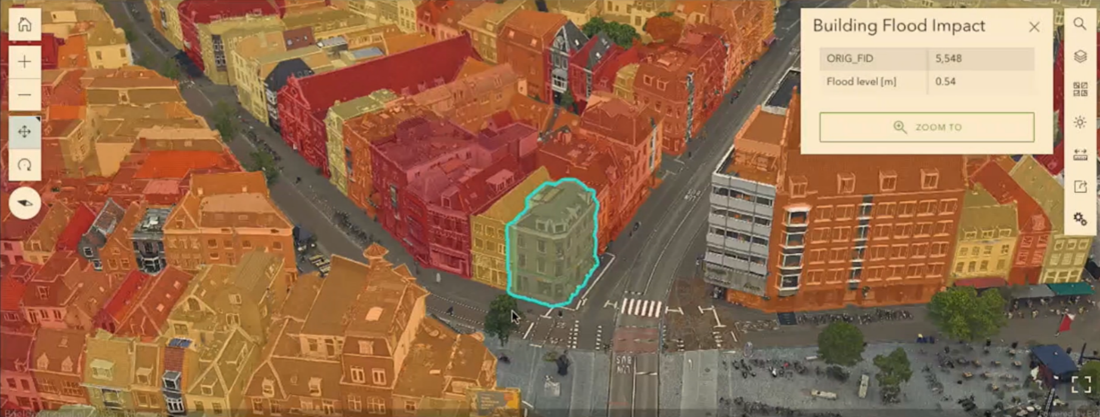
The example below shows a screenshot of a flooding simulation for the City of Utrecht (The Netherlands). The 3D Experience Builder combines lidar, imagery, a flooding model, 2D ortho cadastral data, a 3D Digital Terrain Model and back-end data, that all allow to visually select a building and see/update attributes. The flooding model can calculate height of water for the specific building and categorise (colorcode) damage assessment.
Combining above and underground data in a single visualization
XenomatiX uses and promotes ArcGIS for visualization of the digital road and its quality indices, pinpointing the added value with information layers of above and underground assets. For example, underground utility conducts like fiber or sewage. Layers of conditions scores of road and sewage can be visualized together to use both information to decide which road to repair when, together with the sewage works when required.
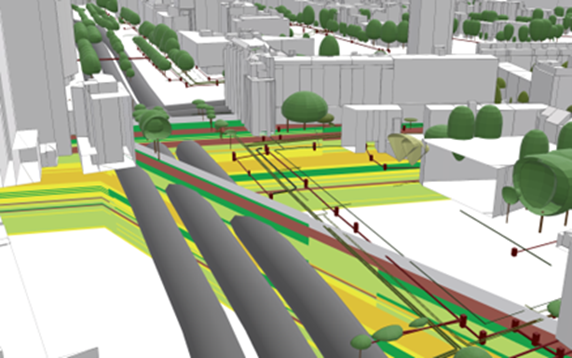
Uploaded on the ArcGIS platform as an extra layer, users can easily determine the status of their road network above ground, evaluate the status of utility conducts below ground and make sound decisions, efficiently using the budget ‘first time right’. Within the Esri platform one can combine data from layers within GIS Systems (On prem Esri Server, ArcGIS Online, competitive products) or non-GIS data sources, depending on the use case, data volume and source of metadata.


