SPONSORED BY ALLVISION
Mobile laser scanners have grown much more powerful and user friendly in recent years, but these tools remain limited by one persistent problem: The point cloud data you get from a mobile survey is huge and complex, making it difficult to process. As a result, many of us are data rich and information poor.
“It’s still a relatively manual process to turn lidar data into something usable” says Allvision co-founder Elmer Bol. Bol and a group of other 3D data veterans are aiming to solve this problem with a new platform that exploits a raft of cutting-edge technologies—including sophisticated lidar-processing algorithms, cloud computing, machine learning, and even a new generation of continuously updated digital twins. Allvision’s platform hopes to make it possible for anyone to process mobile lidar and imagery data at scale, or to quote Bol, “we want to make it pretty much idiot proof to extract information from huge amounts of sensor data.”
SPAR caught up with him last week to discuss the technology behind Allvision, how its approach can drastically change your asset-management workflow, and why a new wave of geospatial data could mean you never touch a 3D scanner again.
What is it?
Allvision’s product is not a simple variation of something that already exists on the market—so it takes a little explaining.
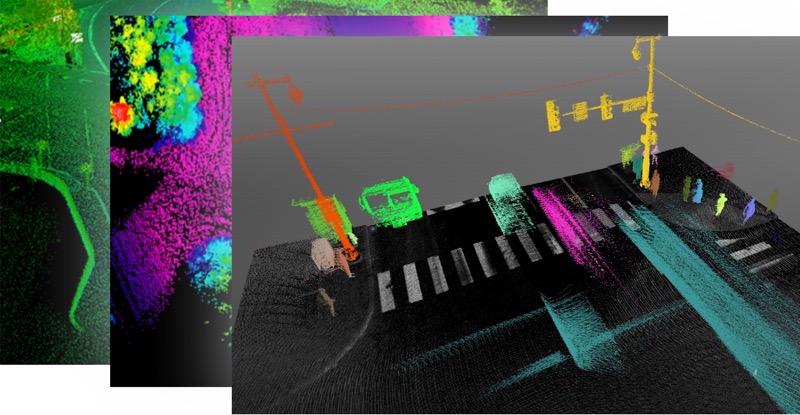
It consists of several layers. The first is a cloud-based “data refinery” that combines extensively scalable cloud computing and machine-learning algorithms. Using these technologies, the system can “munch through huge amounts of lidar and imagery data” captured from a wide variety of sensor stacks. The platform uses two different data pipelines—computer vision for the imagery and a distinct classification engine for the lidar data—and fuses the two together to recognize and classify real-world assets, and improve the speed and accuracy of the entire platform.
The second layer is a web-based user interface that presents actionable information in “a very intuitive way.” This UI is designed so that everyone at your company, from the surveyors to the new intern, can interact with the data and understand what it means.
Finally, the platform offers a programmatic method of interfacing and integrating with other data sources in order to create the final information deliverable. For example, it allows you to connect a railroad switch in the real world with existing asset identification information present in a maintenance system.
Get more value out of the 3D data you already have
Here’s a quick use case to illuminate how these parts work together to help you mine your existing 3D data for better information.
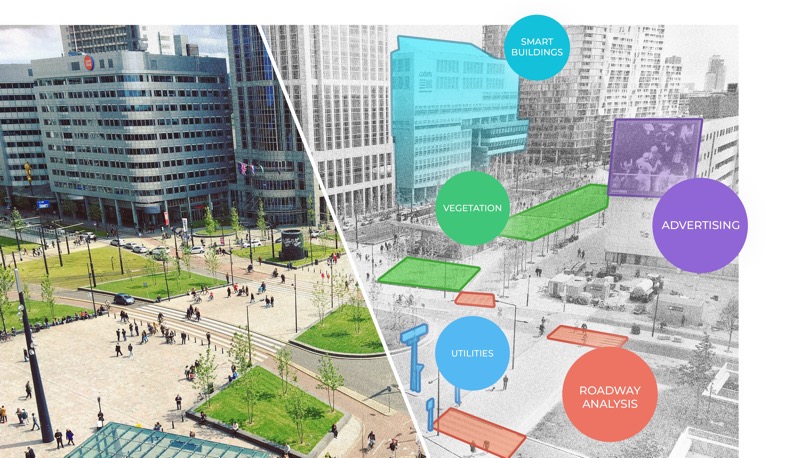
Let’s say you’re a department of public works that works with Allvision to extract all the signs from the latest lidar and imagery data captured in a major city. Logging into the Allvision portal and the system displays an overview map similar to what you’d see in any smartphone-based GPS app. Zoom in on your city and a bunch of tiles pop up with badges showing how much project data they each hold. Open a tile, and you’ll see a heatmap that outlines where data exists (both current and historical), as well as a list of all the signs that the Allvision platform has already automatically recognized and extracted.
Allvision can extract signs from your 3D and imagery data, and greatly simplify your asset management workflow.
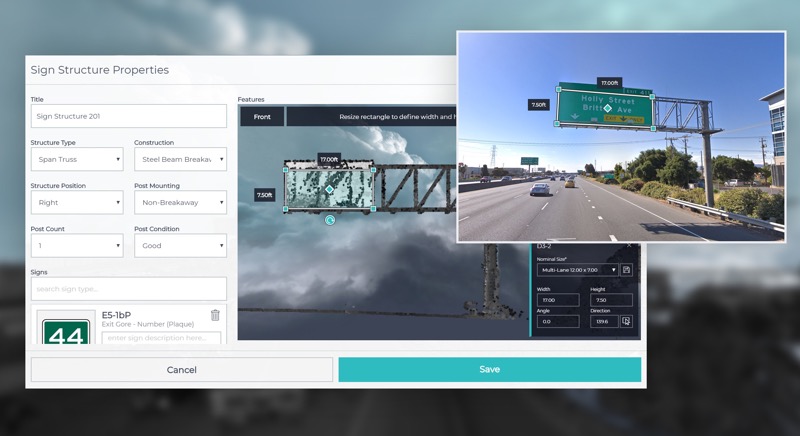
Next, you’ll run through the signs using a QA/QC tool to catch and correct any false positives or false negatives, and then start to set specifications for each sign. For instance, you can use the interface to quickly measure and record the size of the sign, its latitude and longitude, its designation, or the distance between the bottom of the sign and the nearest paint line on the roadway. These calculations are completed in 3D space, and because not based purely on imagery and do not rely on structure for motion reconstruction techniques, are highly accurate.
Bol tells me that Allvision took pains to make these steps easy for non-surveyors to perform. “3D is difficult,” he says, “but here you’re only working with 2D. What we do is essentially only allow the user to work in the plane of the sign.” That means if you’re recording the distance between the sign and the ground, for instance, you won’t have to mess around with finding the bottom of the sign in 3D space. Click on the bottom of the sign and the system snaps the selection in place. Drag the line to the roadway and the system takes care of the rest.
As Allvision processes more data, the company says the system can make it equally simple to record whether each sign is a stop sign, yield sign, speed limit sign, etc. Users will be able to click on the sign, at which point a suggestion engine will offer a list of options pre-populated with the most likely designations.
This designation process will probably be the most difficult part for non-expert users. “In 15 minutes,” says Bol, “you can teach anyone to extract signs, though typically that task would require almost surveyor-grade people in traditional software packages.” This fast workflow should help organizations that are already sitting on a lot of data to get more value out of it—alleviating the problem of being data rich but information poor.
The long-term benefits of machine learning
But even that will get simpler soon due to one of the basic principles of machine-learning algorithms. Here’s how machine learning works: at first, as the algorithm extracts information from the data, a human will need to review the computer’s work and fix what it got wrong. As time goes on, the algorithm will learn from this process, which means it will get better and better at doing its job and require less input from a human.
Likewise, Allvision’s automation will improve over time. The suggestion engine that will populate the menu of sign designations, for instance, may start by offering ten options. As you pick the correct option from the list over and over again, the suggestion engine will learn and start narrowing the options down to three. Eventually, the engine might be able to identify the sign with 99% certainty all by itself.
Another benefit of machine learning is that the Allvision system can be taught to recognize more or less anything that the user wants, as long as that information can be extracted from lidar and imagery. If you want Allvision to extract a new kind of information from 3D data—for instance, where the potholes or light poles are—the company can tune the system to do that, too. Their system will get better and better at performing that task over time.
Allvision makes it easy to turn your 3D data into information about curb grade.
The future of high-frequency geospatial data
Allvision didn’t develop their product only to process existing data for users, but rather to take advantage of what Bol calls the “new wave of geospatial data that’s coming down the pike.” He’s referring to the huge flood of 3D and imagery data that is going to be captured by the sensor stacks in autonomous vehicles during their day-to-day operations.
“We’re essentially going to have all these vehicle-based mobile mappers out there,” Bol tells me. “For the first time, we’re looking at tens of thousands of vehicles—maybe hundreds of thousands, maybe millions in the next five years—mapping the environment continuously. We asked, What would that mean, and what can we do with the data coming off those sensor stacks?”
“So we built a platform to extract assets not only one time,” Bol says, “but repeatedly. The way we talk about it is that we have this living 3D mapping database of assets, sometimes referred to as a digital twin, that we will keep up to date as new data comes in. For example, if you have data coming in twice a year, every time it comes in we will automatically update the assets and highlight areas where things have changed. Our mission is to turn 3D data into digital twins of everything visible from the sidewalk, road, or rail and then integrate with other sources of data.”
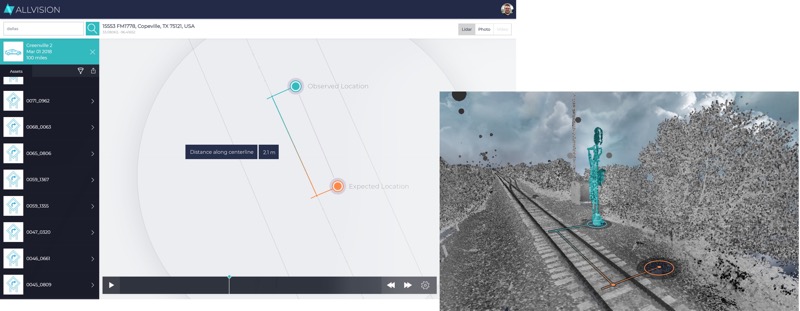
A rail diff.
A higher level of information from your data
Allvision is essentially a very sophisticated difference engine. That means, as you offer it more and more frequent data, it can supply higher and higher levels of information about your assets.
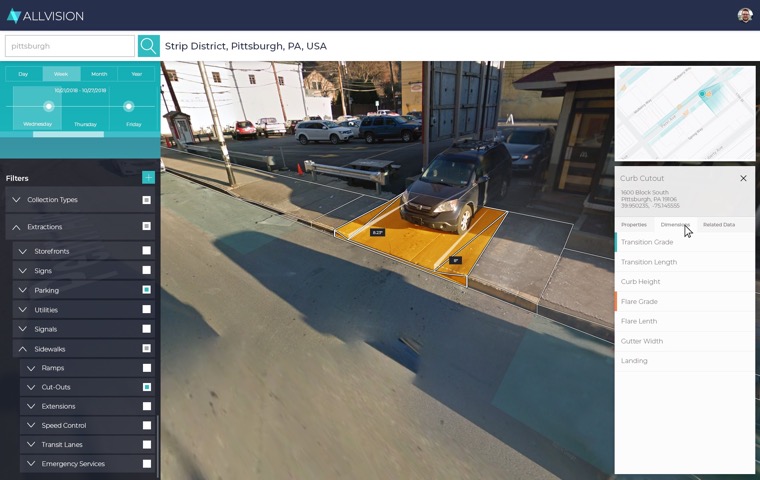
For instance, you could use Allvision’s processing to check regularly whether a city’s curb cuts are compliant with the Americans with Disabilities Act. “This is a big problem for cities,” Bol says. “New York City is getting sued because many of its ramps are out of compliance—and they have 350,000 ramps. I wouldn’t be surprised if many cities are struggling with the same issue.”
Allvision has already started working with customers in the rail industry to perform asset and change detection which eventually needs to be done at an interval of fifteen minutes. “Within fifteen minutes of detection, they want to know if something has moved so the next train down the line knows of the change and can take appropriate action.”
Here’s another use case: curbs in smart cities. Allvision is working to take the lidar and imagery data coming off of autonomous vehicles in urban spaces to extract information that will help orchestrate curb use in a variety of circumstances. That means generating maps that help some of the world’s biggest companies get their last-mile delivery robots to your door, sets of rules that indicate where autonomous vehicles can drop passengers, and better directions for pedestrians. Allvision can even generate regularly updated inventories of parking occupancy in high-traffic areas, which happens to be a project Allvision is already actively working on with the City of Pittsburgh.
This is just the start of a long list of use cases Bol listed. “What we’re looking at,” he says, “is much more dynamic, high-frequency information that can be extracted from lidar and imagery data. That’s much more valuable than just extracting an asset once and not looking at it for a couple of years.”
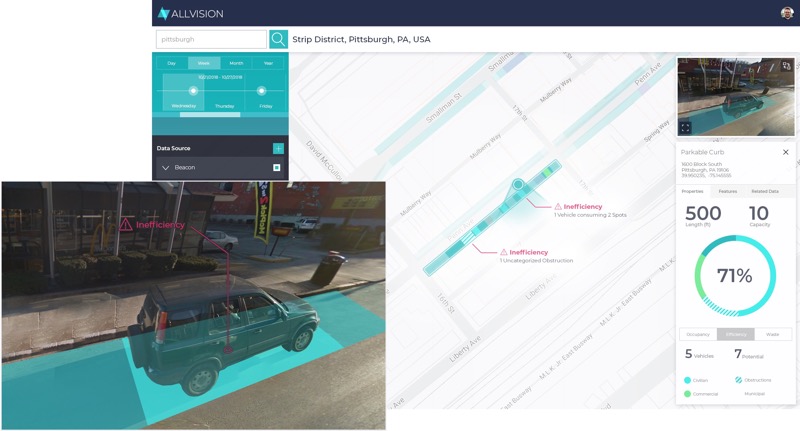
Parking inventory.
Changing the way we capture and consume mobile 3D data
One important side effect of this approach is a coming change in the way we capture and consume 3D data.
For instance, Bol tells me, if you’re interested in vegetation encroachment in a small area where Allvision has data, you could subscribe to that information by the mile. Simply pay a fee and Allvision will supply regular, automated updates about what has changed from scan to scan. That’s bound to be a lot cheaper than buying scanning gear and hiring the manpower necessary to conduct the survey and process the data. For that purpose, he says “we’re always looking for more data partners who want to work with us to get more value, including dollars, from their existing and new data.”
But what if Allvision doesn’t already have the data, or you want to gather data yourself? Allvision will work with asset owners to “sensor up their vehicles.” That way they can “leverage their own fleet to start creating high-frequency data using sensors that cost much less than your traditional $500,000 mobile mapping system. This way, data capture can also be deployed at scale.”
Making mobile 3D much data easier to use
A platform like Allvision’s has the potential to seriously change the way we look at mobile 3D data—and make it much easier to consume.
To recap: The interface is so simple that anyone should be able to use it, which will greatly increase the number of customers who can work with the data. As Allvision continues to bring in more data to its digital twin, that will make it possible to supply increasingly sophisticated, higher-level information for a wider variety of industries. The subscription business model means that some customers may never have to capture a meter’s worth of 3D data themselves.
The idea, Bol says, is not to make the Swiss Army Knife of 3D processing tools. “We’re not focusing on putting a gazillion features in there. Will it do everything that other tools do? Likely not, and that’s not the goal. Will it be much easier to use, and much easier to adopt? Well, if that’s not true, we probably failed.”
If this has made you curious what Allvision can do with your data, they’d love to engage with you to understand your extraction needs. If you’re at ILMF 2019, visit them in booth 205 or check out their website here.